Sector and main panel average results
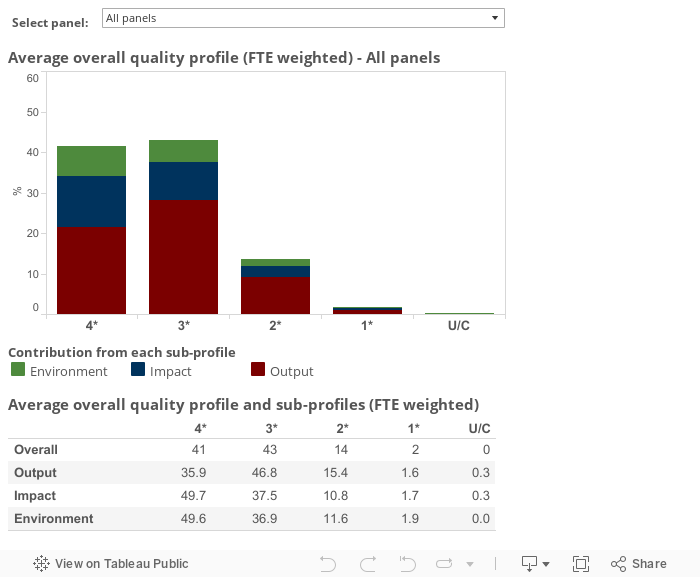
The charts and tables below show the average weighted profiles and sub-profiles for all submissions in each main panel, and for the exercise as a whole.
To calculate these averages, the results for each submission are weighted according to the number of full-time equivalent (FTE) staff in the submission. This means the average profiles take into account the relative size of submissions in the overall outcome. Submissions with 3 or fewer staff (headcount) are excluded from the calculation of the average sub-profiles.